🌎 > Προϊόντα > Αναλυτικός Εξοπλισμός > Εργαστηριακός Εξοπλισμός > Ηλεκτροχημεία > Χαρακτηρισμός Ημιαγωγών > Αναλυτής Φασματοσκοπίας Εμπέδησης με Χρονική Ανάλυση (Time-Resolved Impedance Spectroscopy Analyzer)


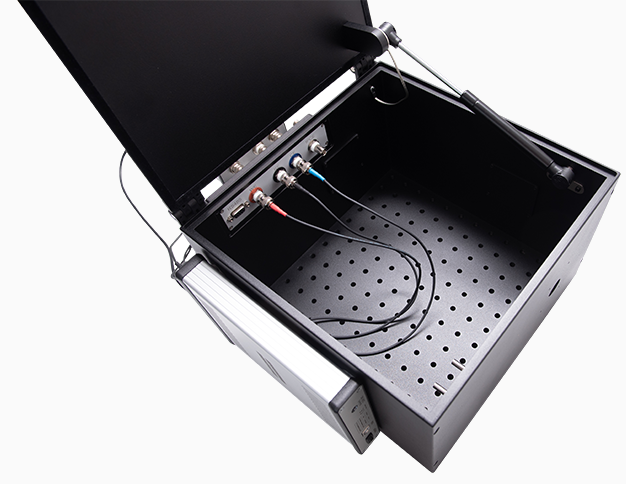
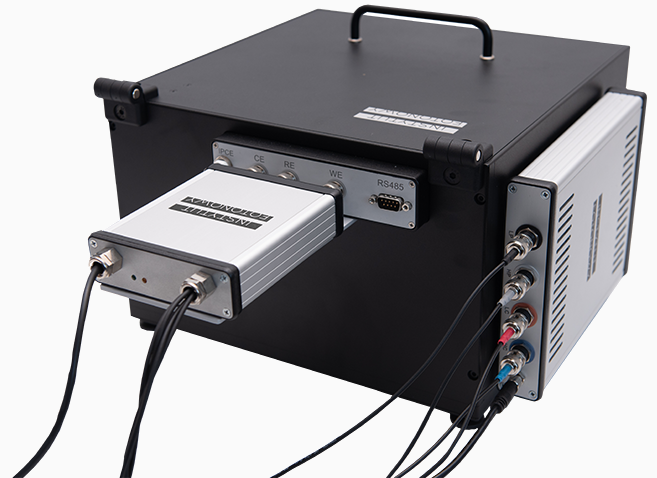
 Time-Resolved Impedance Spectroscopy Analyzer

Κατασκευή Ιστοσελίδων ![]()
![]()
Καλάθι αγορών